On Deciding to Teach the Q Method
While my background is in the natural sciences, I have a tendency for discovering and diving in to new methods, including those that originate or are typically practiced in the social sciences. As I'm helping to design and teach a course on urban sustainability this semester, a course that must cater to students in a professional Master's program that will go on to careers as sustainability practitioners, I have struggled to devise skill-based instruction that serves their needs. The Q Method is a relatively obscure approach to analyzing qualitative data on human subjectivity (although there is an active research community promoting its wider use). Our students are learning that urban sustainability is not an exact science; it is a confluence of discourses and untested proposals for how to make our cities more efficient, healthy, and just. Can the Q Method help them to understand the diverse perspectives on contemporary sustainability issues?
The Q Method
The Q Method is a mixed method that combines a survey of individuals with factor analysis to determine what distinct perspectives are embedded in a population. In the words of van Exel and de Graaf [1], who paraphrase Brown [2]:
Q methodology provides a foundation for the systematic study of subjectivity, a person's viewpoint, opinion, beliefs, attitude, and the like...By Q sorting people give their subjective meaning to the statements, and by doing so reveal their subjective viewpoint...or personal profile.
It is a useful tool for analyzing human subjectivity on a variety of social or technical issues, whether the respondents are experts in a particular field or are drawn from a more general population.
Q Method was devised by the psychologist William Stephenson, who was very critical of the classic statistical analysis advanced by Karl Pearson. In particular, Stephenson's Q Method questions the single, objective reality that is assumed in classical statistics, where the goal is to develop a best-fitting model that tests one of a prescribed set of hypotheses. With the Q Method, no a priori hypotheses are specified. Its practitioners assume the existence of multiple subjective realities. The origin story for the Q Method holds that because classical statistics was a discipline associated with Pearson and, in particular, Pearson's correlation coefficient, denoted \(r\), Stephenson decided that his method should be called "Q" as Q comes before R in the alphabet.
Terminology and Methods
We've all seen surveys that ask us to rate statements on a scale from "Agree" to "Disagree," perhaps from "Strongly Agree" to "Strongly Disagree." These surveys have usually irritated me because this spectrum seems rather arbitrary, the number of gradations from one end to the other too numerous. Am I a "7" or an "8" on this 10-point scale? Do I agree or agree strongly?
The Q Method begins with such a survey but puts more thought into its design and execution. When we survey a group of respondents, also called the P sample (or P set), each is asked to sort a collection of statements, photographs, or other discrete messages along an axis. This axis, however, may be described in different terms from simple agreement and disagreement. We might ask the respondents to sort the statements from "less like how I think" to "more like how I think;" from "less likely to motivate me" to "more likely to motivate me." The statements (or photographs, audio clips, etc.) to be sorted consitute the concourse of communication. The sorting of these statements is also typically constrained by a matrix that approximates a quasi-normal distribution (see below). Each of the responses constitutes a Q sort and the collection of all Q sorts is referred to as the Q sample.

Above, a Q sort in progress is depicted (from Ellingsen et al., 2014); the respondent is sorting the statements into a quasi-normal distribution according to her subjective viewpoint on each.
The "objective" part of the Q Method comes after the Q sample is generated. It involves the application of factor analysis to the Q sample, with the goal of inducing factors that correspond to shared, subjective worldviews related to the councourse of communication. The use of factor analysis belies the subjectivity that enters this part of the method, however. The number of factors to induce is not easily determined. Moreover, the resulting factors require interpretation, which is often highly subjective and even confusing. Consequently, much of what is to be learned from the Q Method comes from the process of conducting the analysis and sharing the results with the P sample that produced the data. When the P sample consists of practitioners, community members, or outside experts, then the Q Method becomes a tool for the co-production of knowledge, which is increasingly important in natural resouce issues.
The Q Method in Practice
The Q Method has been used in sustainability research before. Zeemering (2009) survey San Francisco city officials as to what aspects of "sustainability" are most important to them and their work [4]. The statements for the concourse were drawn from a local non-profit group's report and were ranked by city officals from "least" to "most important in my community." The Q Method has also been used with a concourse of photos, which participants' were asked to sort based on two prompts: 1) as to how the picture makes them feel climate change is important or unimportant; 2) as to how the picture makes them feel they can or cannot do something about climate change [5].
Applying the Q Method to Urban Sustainability
I assigned my students a Q sort exercise with statements that described multiple perspectives on sustainability. The concourse was drawn from two sources: John Dryzek's The Politics of the Earth and another book, Confronting Consumption, edited by Thomas Princen, Michael Maniates, and Ken Conca. These books, particularly the former, explore a number of ways of characterizing sustainability challenges and natural resource issues. Students were asked to sort 21 statements into a matrix based on their agreement with the statement. A quasi-normal distribution was enforced. What follows is a description of the analysis in R.
Organizing the Q Sample
The data are organized as a CSV file with the respondents along the columns and the statements along the rows, as in the example below, whre r1 through r15 are each of the respondents.
q.sample <- read.csv('QMethod_results.csv')
head(q.sample)
##   r1 r2 r3 r4 r5 r6 r7 r8 r9 r10 r11 r12 r13 r14 r15
## 1 -1  0  1  2  2  0  0  1 -1   0   0   2   3   3   2
## 2  2  0  1  1  1  2 -1  0  0   2   3   2   2  -3   2
## 3  1  2  2  1  1  1  1 -3  0   1   2  -2   1   1   1
## 4 -1  2 -2  0 -2 -3 -1  1 -2  -2   0  -2  -3  -2  -2
## 5  0  0  0  0  1  1 -2  1  1  -1   1   0   0   0   1
## 6  0 -1  1 -1 -1 -1  0  0  1   0   0   3  -2   1  -1
Because we used a forced (quasi-normal) distribution (i.e., respondents were constrained to placing statements inside a bell-shaped distribution), we want to make sure that the columns sum to zero (i.e., same number of statements on each side of the curve).
apply(q.sample, 2, sum)
##  r1  r2  r3  r4  r5  r6  r7  r8  r9 r10 r11 r12 r13 r14 r15
##   0   0   0   0   0   0   0   0   0   0   0   0   0   0   0
Exploratory Analysis
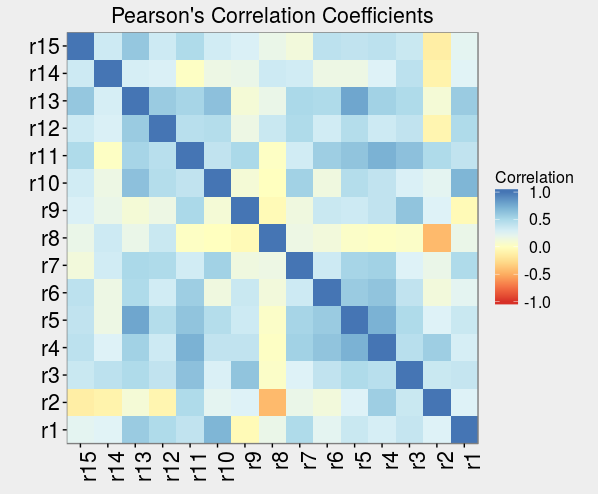
One question we can ask of the Q sample is which respondents are highly correlated with one another?
We can calculate the Pearson's correlations between each pair of respondents using the cor() function.
cor(q.sample)
However, it's more effective to visualize these correlations as a heatmap.
# Calculate the correlations
cc <- as.data.frame(cor(q.sample, method = 'pearson'))
cc$X1 <- factor(colnames(cc), ordered = TRUE, levels = rev(names(q.sample)))

require(reshape2)
# Reorganize the table for ggplot2
cc <- melt(cc, id.var = 'X1', variable.name = 'X2', value.name = 'Correlation')
cc$Correlation <- cc$Correlation

require(ggplot2)
require(RColorBrewer)
pal <- brewer.pal(9, 'RdYlBu')
ggplot(cc,
  mapping=aes(x = X1, y = X2, fill = Correlation)) +
  geom_tile() +
  scale_fill_gradientn(colours = pal, limits = c(-1, 1)) +
  scale_x_discrete(expand = c(0, 0)) +
  scale_y_discrete(expand = c(0, 0)) +
  coord_equal() +
  xlab('') + ylab('') +
  labs(title = "Pearson's Correlation Coefficients") +
  theme_bw() +
  theme(axis.text = element_text(size = 16),
    axis.text.x = element_text(angle = 90, hjust = 1),
    plot.title = element_text(vjust = 1, size = 16),
    legend.title = element_text(size = 12, vjust = 2),
    legend.text = element_text(size = 12),
    legend.text.align = 1)
Choosing the Number of Factors to Induce
When using the Q method, we have to decide a priori how many factors to extract from the dataset. Recall that the factors correspond to the distinct perspectives or worldviews that the population's Q sorts represent. We may have some prior information or expert opinion as to the number of perspectives that exist. For example, in a Q sort of statements related to immigration, we might expect that there would be both pro-immigration and anti-immigration perspectives; therefore, we would try to extract at least 2 factors.
If we don't have any prior information, we can attempt to determine the number of factors from the data alone. This approach, letting the dataset speak for itself, might begin with a screeplot, as below. The screeplot shows the amount of variance (which we can think of as information content) that is explained by an increasing number of factors. Think about this plot in terms of moving to the right along the horizontal axis. As we continue to add factors, we will come to a point where very little information is gained by adding an additional factor. We want to choose the fewest number of factors as possible while explaining as much of the data as possible.
screeplot(prcomp(q.sample), main = 'Screeplot of unrotated factors',
  type = 'l', lwd = 2, cex = 1.5, cex.lab = 1.4, cex.axis = 1.5,
  cex.main = 1.5)
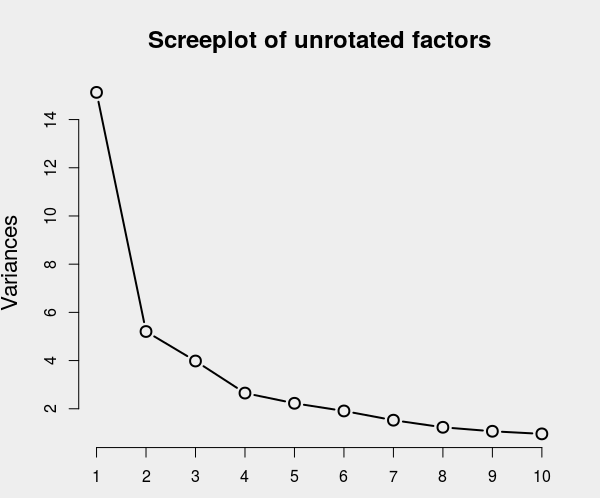
Based on this screeplot, I would estimate there are about 4 or 5 factors in the data.
Performing the Factor Analysis
Once we've decided on how many factors to induce in the data, we can run the final analysis.
I'm using the qmethod package for this analysis.
library(qmethod)
results <- qmethod(q.sample, nfactors = 4)
We can see the factor loadings with:
summary(results)
## Q-method analysis.
## Finished on:             Tue Sep 20 10:07:54 2016
## Original data:           21 statements, 15 Q-sorts
## Forced distribution:     TRUE
## Number of factors:       4
## Rotation:                varimax
## Flagging:                automatic
## Correlation coefficient: pearson
##
## Factor scores
##    fsc_f1 fsc_f2 fsc_f3 fsc_f4
## 1       1      0      1      1
## 2       3      2      0      0
## 3       2      1     -3      2
## 4      -2     -2     -1     -2
...
We can also visualize the results as a plot, where the statements are on the y-axis, ordered from highest consensus (at bottom) to highest disagreement (at top).
require(RColorBrewer)
colours = brewer.pal(4, 'Set1')
plot(results,
  ylab = 'Statements', colours = colours,
  main = 'Factor Loadings by Concourse Statement')
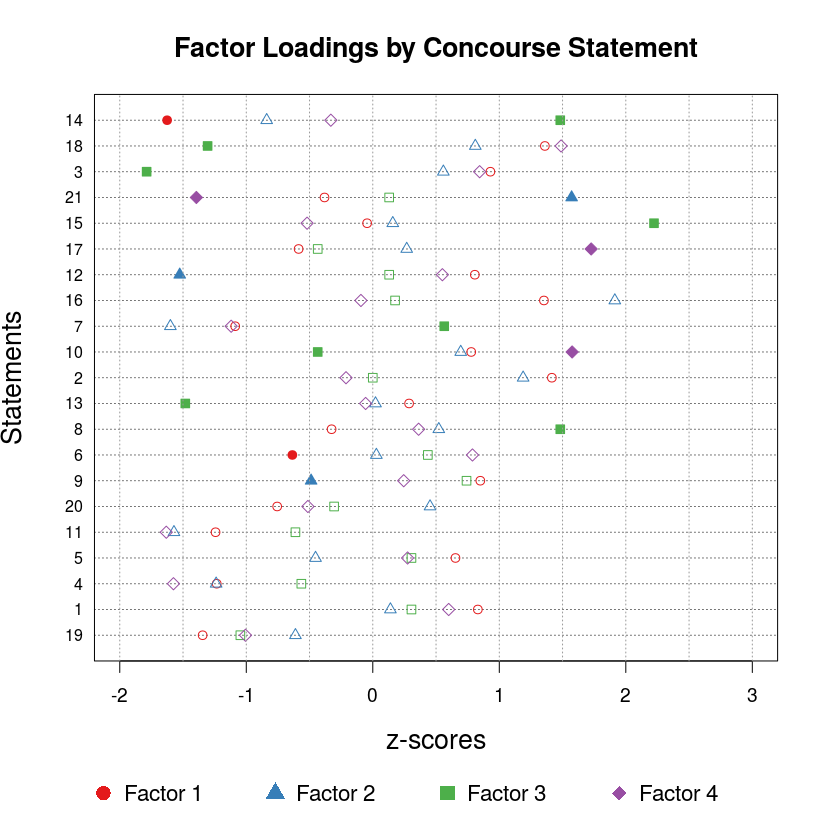
We can see that Statement 1 ("A sustainable society is one that has in place informational, social, and institutional mechanisms to keep in check the positive feedback loops that cause exponential population and capital growth") has the second-highest consensus among the perspectives; that is, no matter what worldview an individual respondent most closely aligns with, he or she was very likely to rate this statement the same way as everyone else. What are the statements with the highest disagreement? Statement 14 ("Growth has no set limits in terms of population or resource use beyond which lies ecological disaster") and Statement 18 ("There is no single pathway to a sustainable future; local experimentation that is pluralistic, incremental, and piecemeal must be allowed so that every possibility for enduring prosperity is considered") saw wide disagreement, indicating that people disagree about limits to growth and whether or not local control is an important component of achieving sustainability.
Interpreting the Factors
Using the summary and the plot outputs in the previous section, we can try to interpret the factors as follows.
Factor 1: Market Reformers
Factor 1 is distinguished by:
- A negative response to Statement 14 ("Growth has no set limits...");
- A negative response to Statement 6 ("Resource exhaustion and environmental degradation are largely a matter of individuals and other actors pursuing their material interests in uncoordinated and decentralized systems").
This suggests that this perspective is skeptical of growth and also about individual responsibility for natural resource problems.
Factor 2: Radical Political Economists
Factor 2 is distinguished by:
- A positive response to Statement 21 ("A focus on individual responses to environmental problems, such as planting trees or recycling, distracts us from the structural and institutional barriers to achieving sustainability");
- A negative response to Statement 12 ("Environmental sustainability can be achieved largely through smart consumers making smart choices about where their food is sourced, how their clothing is made, where they live, and how much they buy");
- A negative response to Statement 9 ("Environmental conservation is not just ecologically sound, it is good for business and economic growth everywhere").
These results suggest that respondents aligned with Factor 2 are conscious of how a broader political economy hampers sustainability and are not convinced that sustainability can be achived through individual consumer choices.
Factor 3: Pro-Market Eco-Modernists Acknowledging Sacrifice Zones
Factor 3 is distinguished by two contradictory statements:
- A positive response to Statement 14 ("Growth has no set limits...");
- A positive response to Statement 15 ("Humans have already appropriated more than our fair share of the earth's finite resource base and further economic growth is impossible").
And also:
- A negative response to Statement 18 ("There is no single pathway to a sustainable future...");
- A negative resposne to Statement 3 ("Advances in science and technology can enhance the carrying capacity of the earth and our resource base");
- A positive response to Statement 7 ("A government-led sustainable development initiative is just another futile attempt to replace markets with political management; instead of trying to impose discipline on people's decisions, we should adjust the market's price system");
- A negative response to Statement 10 ("Sustainability planning can work through government's creation and enforcement of environmental quality standards");
- A negative response to Statement 13 ("Economic growth in all parts of the world is essential to improve the livelihoods of the poor, to sustain growing populations, and eventually to stabilize population levels");
- A positive response to Statement 8 ("Inevitable population growth and desirable economic growth can never be accomodated by the earth's resources").
This is a confusing array of positions. The only sense I can make of this is that respondents aligned with this view are market boosters who think that Western industrial society represents the peak of human efficiency and yet acknowledge that this reality has created ecological sacrifice zones in the rest of the world, which will never catch up.
Factor 4: Pragmatic Social Engineers
Factor 4 is distinguished by:
- A negative response to Statement 21 ("A focus on individual responses to environmental problems...distracts us from the structural and institutional barriers to achieving sustainability");
- A positive response to Statement 17 ("In order to avoid the disruption of the earth's life support functions, a centrally coordinated plan for action is needed with enforcement administrated by a global governing body")
- A positive response to Statement 10 ("Sustainability planning can work through government's creation and enforcement of environmental quality standards").
These statements distinguish an interesting composite view of sustainability issues both at local and global scales. This view suggests that individual behaviors should conform to a global development plan, enforced by central governments, for the proper management and conservation of natural resources; a confidence in the ability of governments to change human behavior. They are pragmatic because they don't seem to believe that personal choice alone is enough to achieve sustainability.
Checking the Factor Loadings
Finally, we can see how each respondent loads onto each factor (i.e., how they align with each perspective).
results$loa
             f1         f2           f3          f4
r1   0.07740761  0.8594596  0.005231051 0.096248126
r2   0.11055604  0.2496759 -0.825336473 0.320306693
r3   0.35672108  0.2638716 -0.057400350 0.771305939
...
Concluding Remarks
Three of the four factors identified represent interesting and probably real world views. Moreover, the loadings on these factors persists when I induce 5 factors instead of 4, suggesting they are stable. Factor 3, however, is hard to interpret. It likely indicates that the students did not understand Statements 14 and 15 (or, more precisely, did not understand them the same way I did when I chose them).
There are two significant areas for improvement in this example that would be essential next steps were this a real study. First, the concourse of communication was drawn from books the students have likely never read; they may not understand what the authors of these statements mean by them. In general, the concourse of communication should be drawn from written or spoken statements by the individuals forming the P sample. For urban sustainability studies, this might involve interviewing sustainability practitioners and selecting statements from across multiple individuals, who later will each conduct a Q sort. Second, the Q sort matrix was probably not well suited for this study. A larger body of statements and more slots to accomodate them in the tails of the distribution would likely have improved the results. While there is little advice that been able to find on designing these matrices or selecting the elements of the concourse of communication, there is promise to this method, at least in the classroom.
References
- Exel, J. van, & Graaf, G. de. (2005). Q methodology: A sneak preview.
- Brown, S. R. (1993). A primer on Q methodology. Operant Subjectivity, 16(3/4), 91–138.
- Ellingsen, I. T., A. A. Thorsen, I. Størksen. (2014) "Revealing Children's Experiences and Emotions through Q Methodology."" Child Development Research. 2014. Article ID 910529.
- Zeemering, E. S. (2009). What Does Sustainability Mean to City Officials? Urban Affairs Review, 45(2), 247–273.
- O’Neill, S. J., M. Boykoff, S Niemeyer, S. A. Day. (2013) "On the use of imagery for climate change engagement." Global Environmental Change 23, 413–421.